13-06-2022 I solve problems by using data... and yes, you can too!
Imagine a big chemical plant and the production depends on 2 big fans to clean the fumes before they leave the stack.

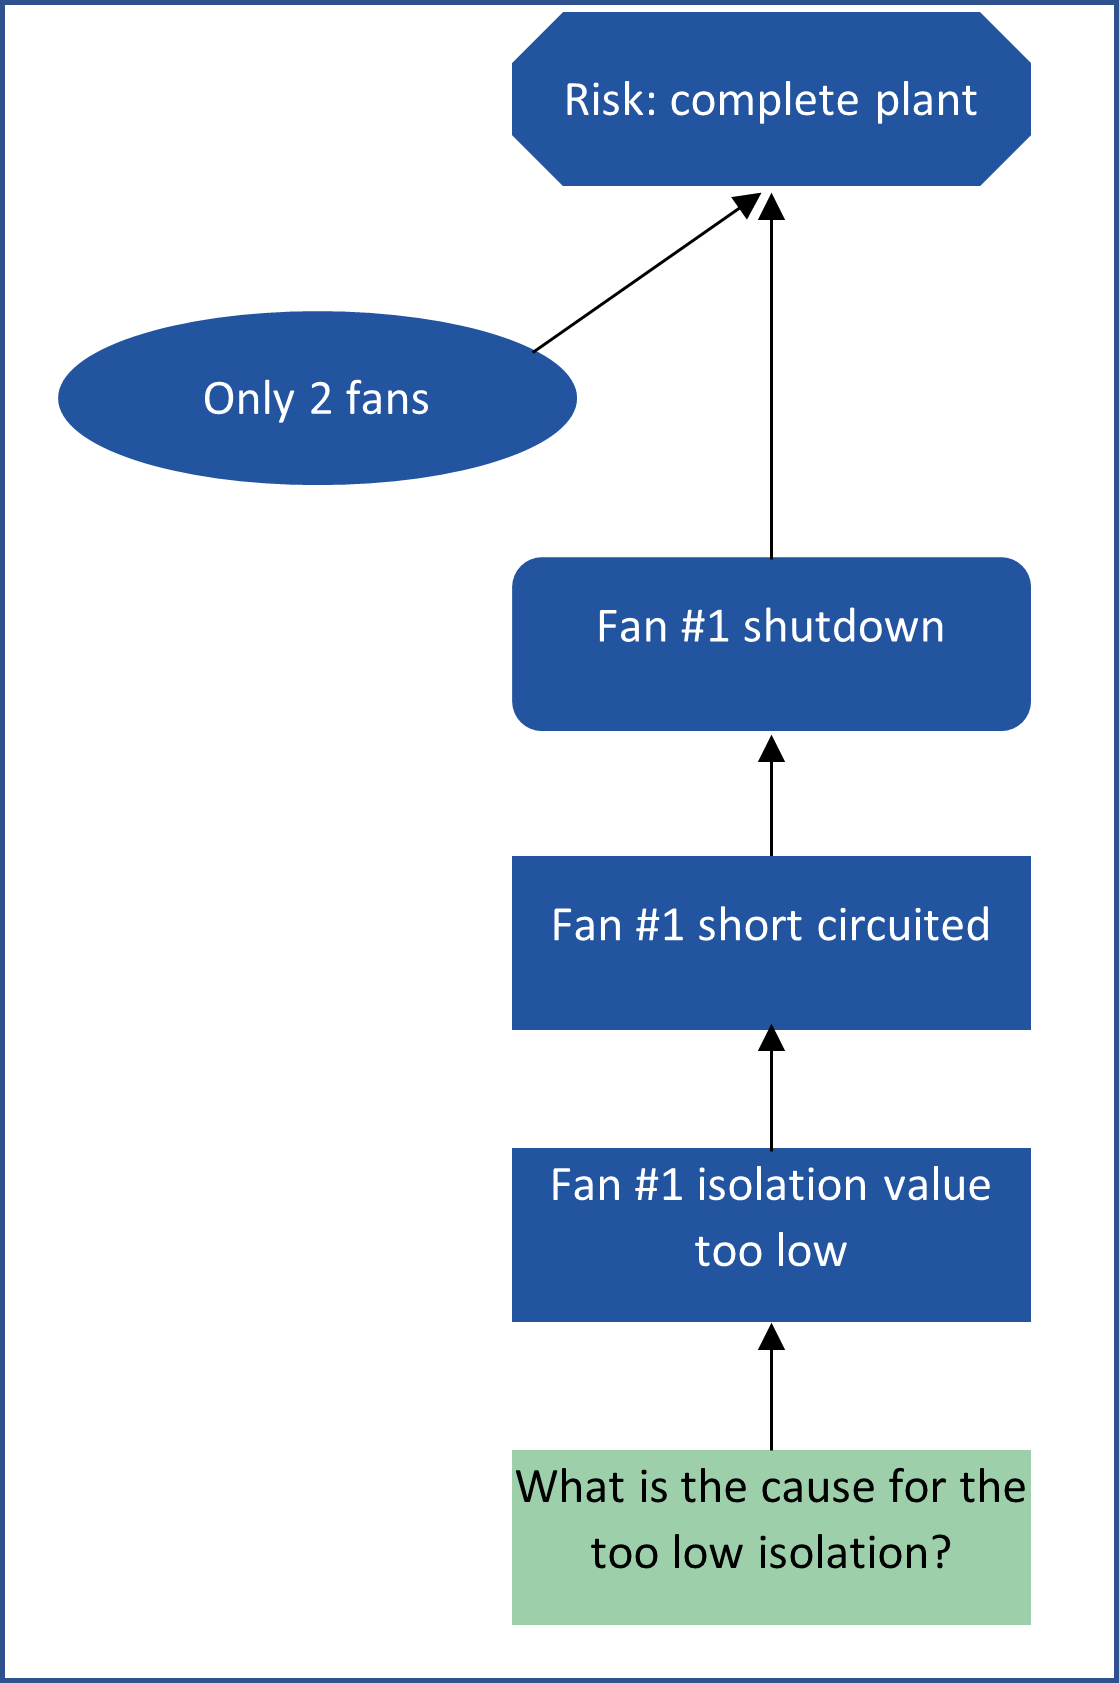
And suddenly, one of those fans’ trips. It fails, it stops because is it’s short circuited. Production can continue but with the risk of losing the other fan everyone feels the urgency to get the fan back online.
Amidst the rapid evolving situation there is you, a reliability engineer, who has given the task to determine the root cause of the failure. Soon the motor will be replaced with the spare one, but the plant manager wants to know for certain what the cause is. All your problem solving skills can now pay off in preventing the next motor from burning up.
This not so average day is a great example how data can help you to make quick and valid decisions based on data, experience and problem solving skills. This was the day that data driven problem solving saved the plant. Let me tell you how I helped to find the root

cause on a nice summer day in Charlois.
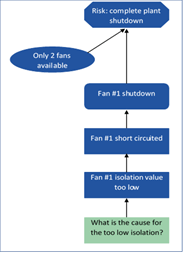
First things first To solve the problem, what do we know? The Event Map shows the causal chain of cause and effect. Inspection of the motor learned that it short circuited because the isolation values were too low. That was caused by overload. The cause for the overload was unknown although the pictures from the internals showed a steady degradation instead of a sudden incident. After discussing with the experts, you decide to look into the patterns of the power consumption.
Key take away #1:
As a reliability engineer, I know a lot of different things but I’m not the expert. Problem solving 4.0 means always collaborating. For example, with my colleague the electrical engineer. He showed me where I could take the data from the SCADA system to search for the cause.
The game is on The hunt for answers has started. And data will provide that answer. But what a mess: which values should I take? There are at least 9 different values I could pick to analyse the motor currents. Should I pick all of them? And what sample size do I use? Seconds, minutes, milliseconds? Back to my colleague to make sense of the data.
Key take away #2: Ask for help to get the right data with the right granularity. I cannot afford to make assumptions that would ruin the RCA.After a long day data crunching in Excel a certain pattern emerges in the data: every 50 minutes there is a spike to 1600 Amps. It doesn’t trip the motor, its built for that but the normal load is about 1100 Amps with occurs most of the time. So, there was the smoking gun but what is causing the 50-minute interval.
At operations controls they told me that it coincided with the flushing interval of the demister. And they also cared to share that it was plugged for some time now. Say a few months or so. In the end the demister was unplugged, preventive actions were reinstated and the new fan is still running to this date.
 Is this data analytics
? Well, I used data to solve the problem, that’s for sure. But it was part of a bigger picture. It was a part of the problem solving process that was supported by leadership, skills and persistence to find the root cause.
Key take away #3 Data Analytics is a tool that can only be successful in an environment that supports problem solving.
I was always fond of data and since that day even more. Since than I have solved way more complex problems with the help of data, but this example reminds me how to start: with the experts, a clear goal and with room for iterations to solve the problem together.
More info?
Bart Smit - Data Driven Problem Solver